In this article, we will talk about advances in developing SERS substrates for molecular detection.
Raman spectroscopy is a non-destructive chemical analysis technique that identifies different molecular compounds and molecular structures through their fingerprints while requiring little sample preparation. It has applications in many fields, such as pharmaceuticals, geology and mineralogy, material research, life-science, and process monitoring.
The underlying physical mechanisms are illustrated in Figure 1. A powerful light source, such as a laser, at a frequency ωL incident on a molecule induces it to undergo a transition to a higher virtual electronic energy state. Upon relaxing, the molecule can undergo one of three transitions. First, a return to its ground state, whereupon a photon of the same energy as the exciting laser is emitted, this being the most frequent transition known as Rayleigh scattering. Second, a lesser frequent transition occurs when the excited molecule relaxes to a vibrational energy level that is higher than the ground state and, in the process, emits a less energetic photon (red-shifted) as compared to ωL. This transition is known as a Stokes Raman scattering and constitutes the majority of the collected Raman spectra. A third possible transition occurs when the molecule is originally in an excited vibrational level in the ground electronic state and the laser promotes it to a higher excited state. The molecule then relaxes to a lower excited vibrational level while emitting a photon at a higher energy (blue shifted) as compared to ωL. This transition is known as the anti-Stokes Raman scattering. At normal temperatures, most molecules are in their ground state, with far fewer molecules in an excited vibrational state ready to emit anti-Stokes scattered light, resulting in a significantly lower intensity compared to the Stokes scattering which originates from the more populated ground state.
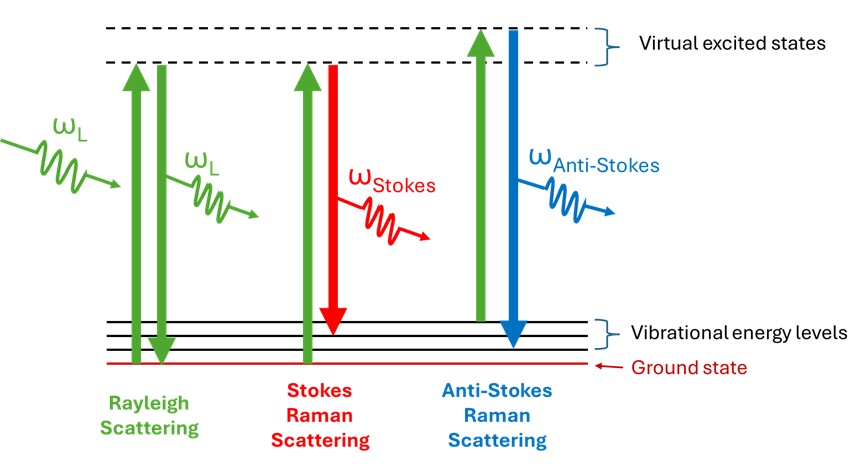
Figure 1: Underlying physical mechanism behind a Raman spectrum.
Rayleigh scattering is the scattering of light by particles or molecules that are much smaller than the wavelength of light. The strength of Rayleigh scattering is proportional to the inverse of the wavelength to the fourth power, thereby scattering the blue light stronger than the red light. This is the physical mechanism responsible for the blue color of the sky. Because Rayleigh scattering is a simple elastic scattering process, it is much more probable than the less-frequent inelastic Raman scattering which involves an interaction with the molecule in the form of energy exchange. In a Raman measurement, the scattered photons are mostly dominated by Rayleigh-scattering with typically 1 photon scattered due to a Raman process for every 1 million Rayleigh scattered photons, resulting in a low sensitivity, i.e. making it difficult to measure low concentrations of a substance.
One possible solution to this low-sensitivity problem involves the use of surface-enhanced Raman scattering (SERS) substrates for molecular detection. SERS spectroscopy, first discovered in 1974 (Fleischman, 1974), is a technique that greatly enhances the molecular Raman signal, thereby permitting the detection of various analytes at very low concentrations reaching the limit of a single-molecule detection (Fan & Brolo, 2009). It has many well-known uses including the detection of food additives or contaminants such as melamine in milk and the identifications of various drugs such as heroin and cocaine (Mosier-Boss, 2017) and it is also employed in forensic science, pharmaceutical manufacturing, and the early detection of various diseases.
The mechanism of the Raman signal enhancement using SERS, illustrated in Figure 2, is chiefly due to the process of electromagnetic field amplification. This amplification occurs due to the optical excitation of collective electron oscillations, known as localized surface plasmons (LSPs), in the nanosized metal structures of a typical SERS substrate by the incident laser. An LSP, which is shown as positive/negative charge dipoles in Figure 2, is strongest when the wavelength of the employed laser matches the LSP resonance (LSPR) wavelength. The LSPR wavelength depends on the size and material of the nanoparticles and for a fixed material, it is longer, i.e., red shifted, as the nanoparticles get larger. The excitation of LSPs localizes and amplifies the electric field of the incident light (Einc) at the so-called “hot spots” areas which form in the gap between adjacent nanosized metal structures that are very close to each other, e.g., spaced by a few nanometers. This ultimately results in orders of magnitude enhancement of the emitted Raman signal from the molecule under study with the highest enhancement occurring when the molecule is situated at the hot spot.
Within the generally accepted zero-Stokes-shift-limit approximation, the enhancement of the Raman signal due to the electromagnetic field enhancement of a SERS substrate, , is equal to the ratio of the magnitudes of the localized electric field (Eloc) to that of the incident laser light (Einc) raised to the power of four, i.e., G_SERS=|Eloc/Einc |^4, with the highest value attained at hot spots having the smallest gaps.
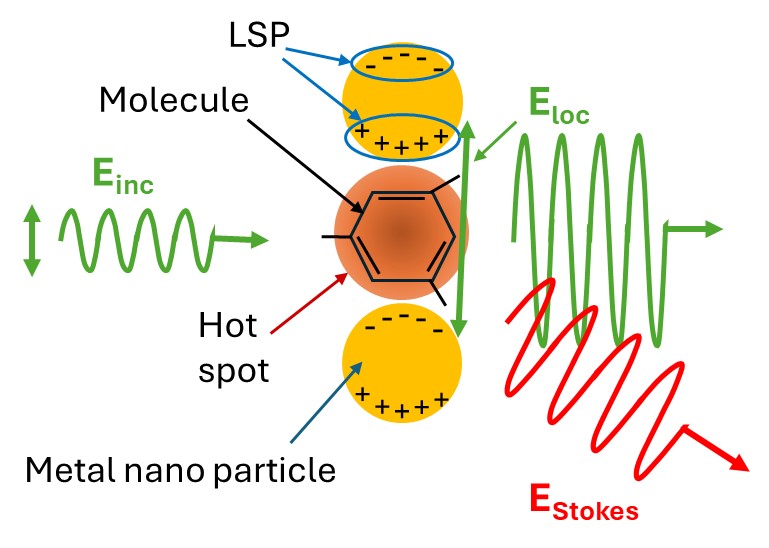
Figure 2: Field enhancement mechanism in SERS substrates.
Another mechanism for SERS enhancement, albeit much weaker than that of incident-field amplification, is chemical enhancement. The interaction of the molecule with the metal of the SERS substrate modifies its polarizability and hence the Raman cross-sections of its vibrational modes. This chemical interaction influences the spectral pattern of the SERS spectra (i.e., the Raman shifts and the band intensity ratios).
These unique properties of SERS substrates not only boost the Raman signal but also allow the detection of single molecules (Fan & Brolo, 2009), which is a significant advancement over traditional Raman spectroscopy. The enhanced electromagnetic field effectively lowers the detection limits of the technique, making it highly sensitive and specific for analyzing molecular structures even at very low concentrations.
Multiple geometries and fabrication processes that share the goal of keeping the nanosized structures in close vicinity have been suggested resulting in a variety of commercially available SERS substrates. In specific, the SERS substrates from Nefer Ka employ metal nano caps atop polymer nano pillars that are fabricated on a polymer carrier sheet, as illustrated in Figure 3. Hot spots areas are located between the adjacent nanocaps with some nanocaps appearing in a singlet, doublet or triplet (not shown) format. The elevation of the nano caps far from the polymer carrier, in addition to the presence of metal coatings between the nano pillars, ensures the lack of a background signal from the carrier polymer. In addition, Nefer Ka’s patent-pending geometry provides a great advantage over other commercial SERS substrates, that of Fluorescence Quenching.
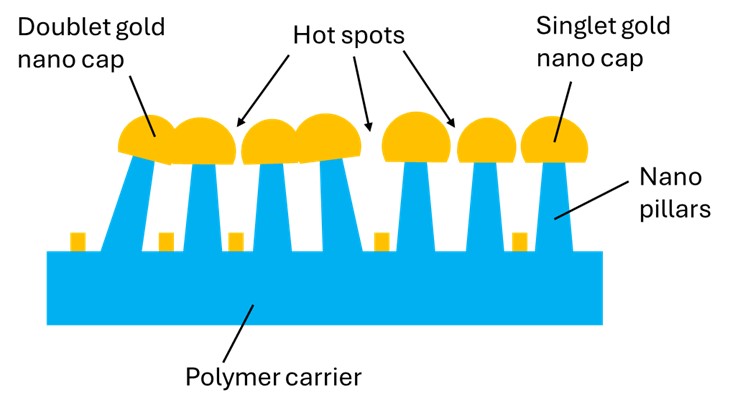
Figure 3: The general structure of Nefer Ka’s SERS substrates.
For some analytes, the collected Raman spectrum can be swamped by fluorescence. Nefer Ka’s SERS substrates’ geometry circumvents this problem and provides a higher signal-to-noise (SNR) ratio by quenching the deleterious fluorescence. A typical Raman spectrum of a highly fluorescent dye (Rhodamine B) that is collected using Nefer Ka’s SERS substrates with an excitation wavelength λ = 632 nm is shown in Figure 4, exhibiting a high SNR with no overarching broad background from fluorescence.
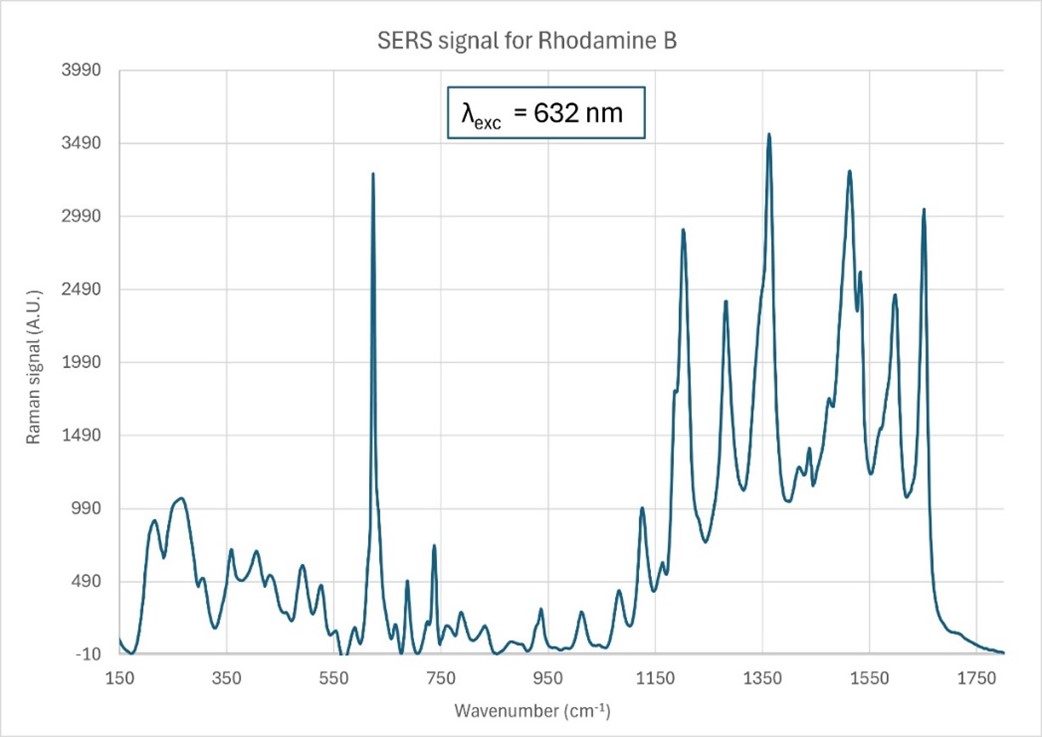
Figure 4: Raman spectrum of the highly fluorescent dye Rhodamine B, collected using Nefer Ka’s SERS substrate at the excitation wavelength λ= 632 nm showing no broad background fluorescence.
Figure 4: Raman spectrum of the highly fluorescent dye Rhodamine B, collected using Nefer Ka’s SERS substrate at the excitation wavelength λ= 632 nm showing no broad background fluorescence.
Other advantages of using Nefer Ka’s SERS substrates, in addition to the fluorescence quenching, include the following:
- Substrates are customizable to any size or geometry
- Substrates can be flexible if needed
- Substrates are produced using a scalable manufacturing technique
- Ease of use, substrates are mounted on a microscope slide
- Uniform signal
- Low background signal
- Broadband range of excitation
- Long shelf lifetime (1 year from date of purchase)
References
Fan, M., & Brolo, A. (2009). Silver Nanoparticles Self-assembly as SERS Substrates with Near Single Molecule Detection Limit. Phys. Chem. Chem. Phys., 11, 7381–7389.
Fleischman, M. H. (1974). Raman spectra of pyridine adsorbed at a silver electrode. Chem. Phys. Lett., 26, 163-166.
Mosier-Boss, P. A. (2017). Review of SERS Substrates for Chemical Sensing. Nanomaterials, 7, 142.