Introduction
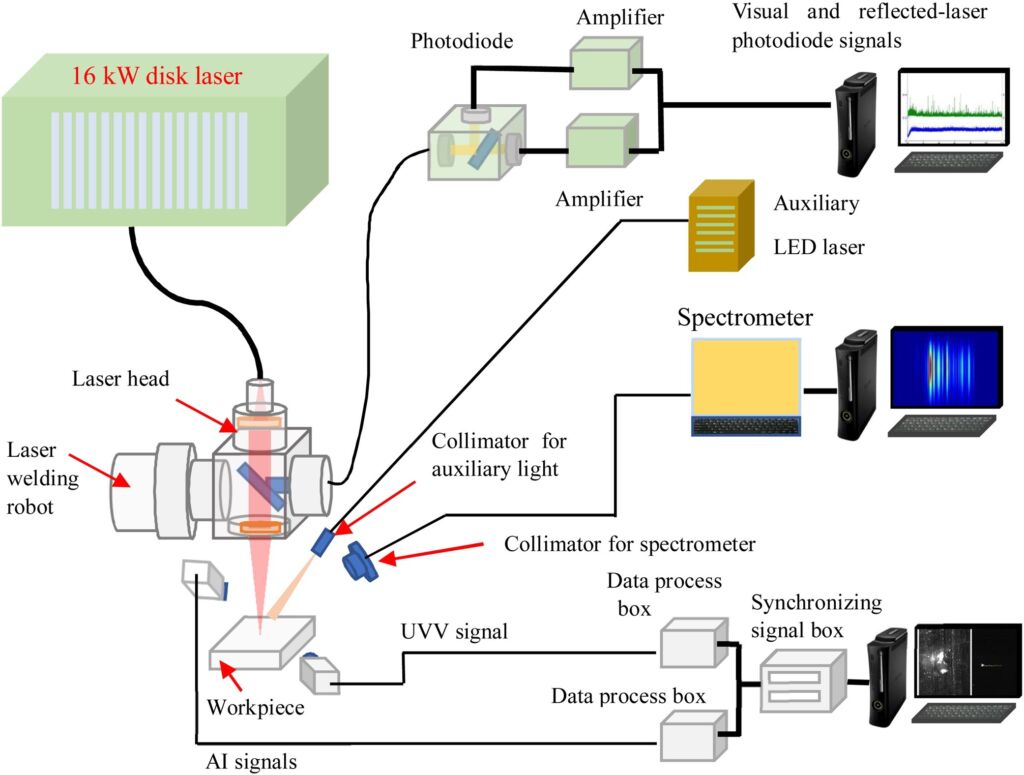
We frequently use disk laser welding in the manufacturing sector (e.g., see Figure 1). The laser beam interacts with the material to carry the welding energy, with the result that some of the beam energy is absorbed and the remainder is reflected. Rapid heating of the material using a laser beam with a high power density leads to boiling of the material followed by severe vaporization.

Figure 1. The experiment setup and the multi-sensor system. Image courtesy of Elsevier
Due to the interaction of the recoil pressure caused by vaporization and buoyancy force, a keyhole appears beneath the laser beam. Moreover, because of the multiple reflections that occur in the keyhole, the keyhole’s presence increases the work piece’s ability to absorb laser energy. At the same time, the keyhole produces a plasma and plume that are induced by the high energy density of the laser beam. Additionally, a few spatters emerge from the molten pool as a result of the intense recoiling pressure brought on by the material’s rapid vaporization.
As sensors have the capacity to offer comprehensive, high-dimensional information on spatters, keyhole, molten pool and plume, and plasma, it is a good idea to use visual sensing methods to examine mechanisms during laser welding. Due to their straightforward construction and low price, photodiodes and spectrometers are regarded as the most suitable technologies for detecting optical features in industrial manufacturing.
High-power disk laser welding produces welds with poor look and significantly reduced strength due to weld imperfections. The model between the in-process signals of the phenomena during high-power disk laser welding and the welding flaws must be constructed in order to automatically detect the weld faults in real-time.

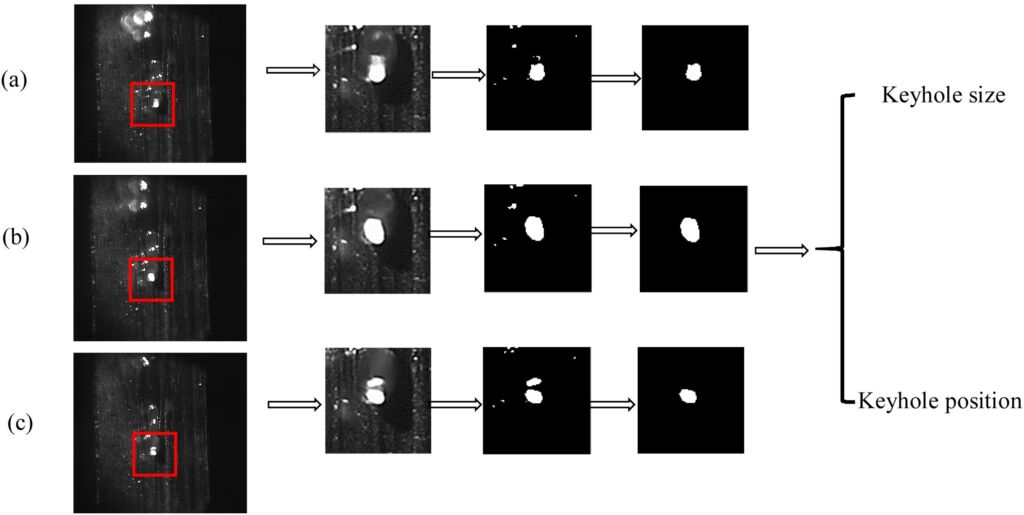
Figure 2. A series of images captured by vision sensor system and their features extraction. Image courtesy of Elsevier
Motivation for using machine learning in disk laser welding
Machine learning techniques, such as support vector machines and artificial neural networks, have been used to implement data-driven process monitoring in the production of goods. Machine learning aims to assist computers in learning and solving some complex perception tasks such as image classification, speech recognition, object detection, natural language processing, etc.
In this article, we introduce a powerful deep learning framework for real-time weld flaw detection utilizing multi-sensor technologies. Researchers in USA and China have proposed this deep learning framework for the first time.
There are two steps. First, we extract keyhole and molten pool features from the vision sensor system as well as plume and spatter features from the UVV band vision sensor system using digital image processing techniques (see Figure 2). Additionally, we use the wavelet packet decomposition (WPD) method to collect the characteristics of photodiode signals. In the second step, we mark the weld flaws in accordance with the international standard.
Eventually, we build a deep learning framework based on convolutional neural networks (CNN) in order to model the relationship between the quantized features obtained from the multiple-sensor data and the clearly specified weld faults.
Machine learning framework
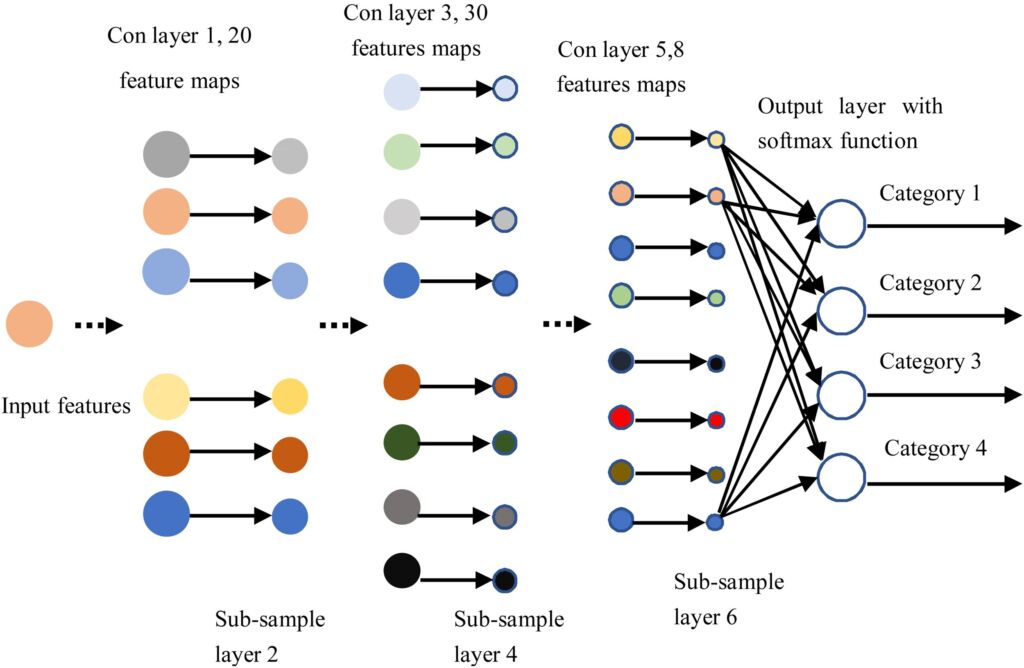
The CNN model can effectively compress the input data with the convolutional layers. The CNN model requires an enormous amount of computing and time resources to train. Once the CNN model has been built and trained, classifying each feature sample is a quick and easy task. Figure 3 shows the structure of CNN (i.e., machine learning framework). In order to determine the best parameter values for training the CNN model, we tune the learning rate, learning momentum, and number of feature mappings in the last convolutional layer.

Figure 3. The structure of the CNN model. Image courtesy of Elsevier
Results and discussion for disk laser welding
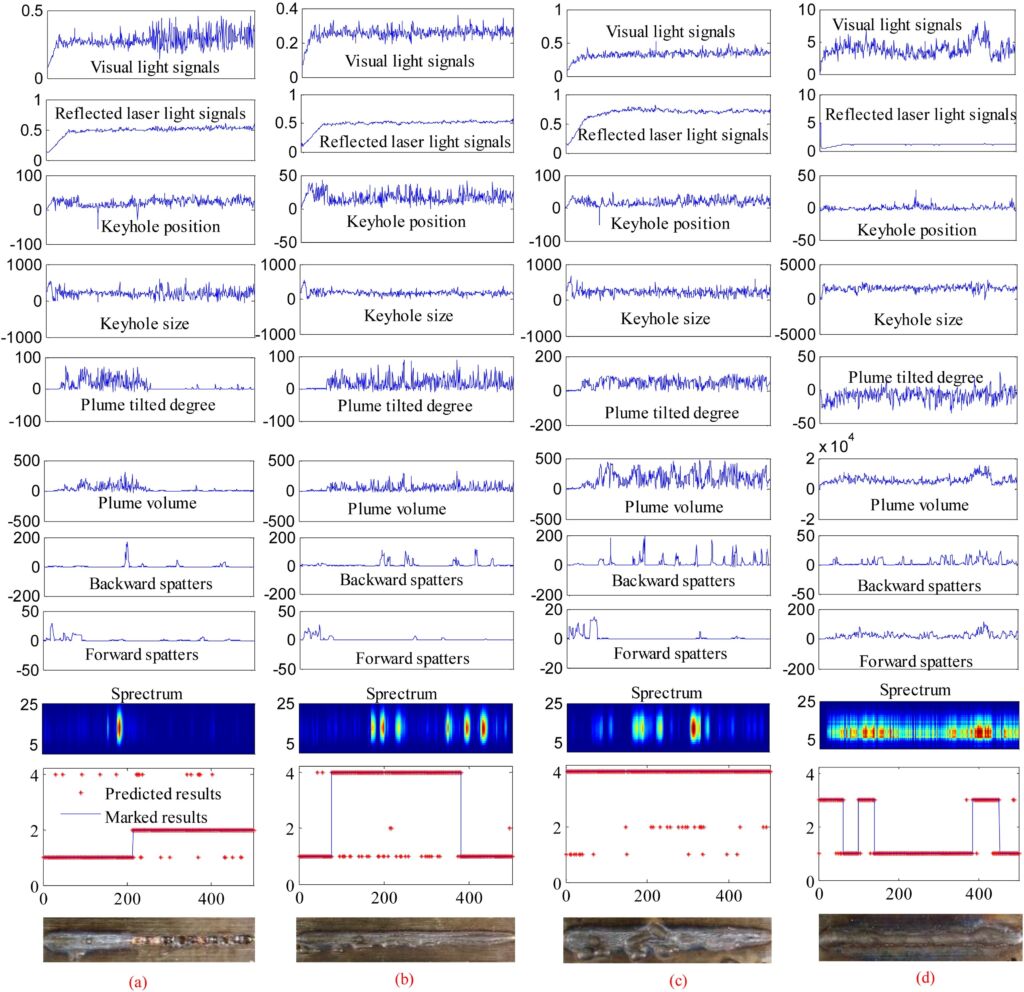
To verify the precision and efficacy of the suggested CNN model, we use four separate welding experiments. Figure 4 displays the visual light signals, reflected laser signals, keyhole position and size characteristics, plume tilted degree characteristics, plume volume characteristics, backward and forward spatter characteristics, spectrum information, and the online predicted results of the four welding experiments along with their corresponding weld appearances.
As we can observe in Figure 4, the welding process is separated into two sections: the first section is stable and the weld gains a good appearance; the second section experiences blowouts and the weld’s appearance declines. The keyhole size, properties of the plume, and fluctuations of signals collected by two photodiodes indicate good agreement with the weld quality. Figure 4 also depicts the undercut defect that appears in the midst of this experiment as well as the undercut flaws throughout the entire welding operation. The humping faults seen in Figure 4 are caused by the welding process, and this experiment’s visual light signal and reflected laser signal are distinct from those seen in the other three tests. In comparison to prior tests, the values of the visible light signal are significantly larger and the reflected laser signals are relatively smaller. During high-power disk laser welding, the intensity of spectrum information with humping is greater than that of other statuses.

Figure 4. Disk laser welding; online classification results and captured signals of four different experiments. (a) Experiment 1; (b) Experiment 2; (c) Experiment 3;(d) Experiment 4. Image courtesy of Elsevier
Conclusion
We discussed a novel approach based on CNN deep learning algorithm to predict welding flaws online using the signals collected by the multi-sensor system. We extract keyhole size and position as quantified characteristics from the photos captured by the vision sensor system, while we extract plume volume, plume tilt, forward spatter number, and backward spatter number from the images captured by the UVV band vision sensor system. To obtain the precise properties of the welding area in the frequency and temporal domain, WPD divided the photodiode signals into 16 frequency bands. The spectral characteristics of the welding process were provided by the spectrometer. In the course of high-power disk laser welding, this article presented a novel technique for online weld flaw detection.
At the end, we highlight the most important components of this article:
1. The researchers in USA and China used the wavelet packet decomposition method (WPD) to retrieve the characteristics of the photodiode sensors.
2. By dividing the 400-900 nm wavelength range into 25 sub-bands, they used the statistical approach to determine the characteristics of the spectrometer.
3. They used digital image processing to extract the characteristics of the UVV band vision sensor system and the supplemental illumination vision sensor system.
4. For high power disk laser welding, they developed a deep learning system based on convolutional neural network (CNN) to identify the three different weld flaws.
