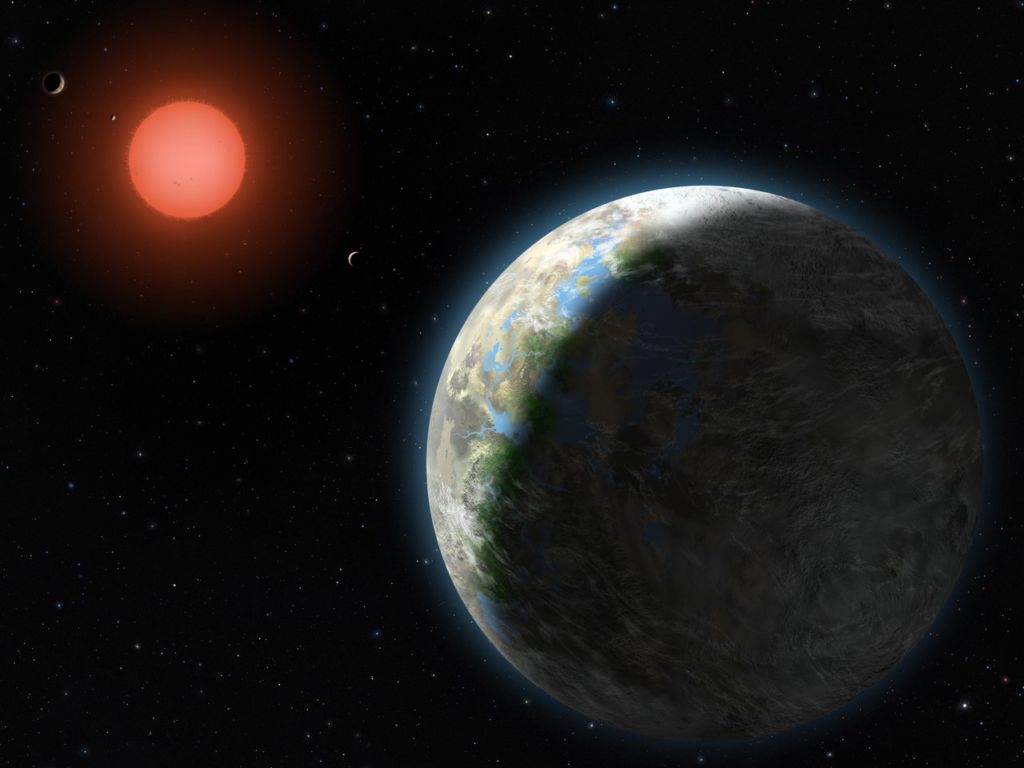
Artist’s depiction of an exoplanet. Courtesy of NASA.gov
Ten years ago, the idea of detecting planets outside of our solar system (a.k.a. an exoplanet) was nothing more than a far-fetched dream. However, in the last few years, powerful ground based and space telescopes have allowed us to detect and study exoplanets. For example, Kepler Space Telescope was launched by NASA in 2009 to primarily detect exoplanets. Since the day of its launch, Kepler has detected over 2,342 exoplanets. As a result, Kepler has revolutionized the field of detecting exoplanets. One drawback of using Kepler is that it is not powerful enough to detect the physical characteristics of exoplanets (temperature, pressure and thermal flux). Current research aims to detect and construct temperature maps of exoplanets by using a new telescope: James Webb Space Telescope.
James Webb Space Telescope (JWST) is an infrared space based telescope that is scheduled to launch in early 2021. One particular research group hopes to obtain the temperature maps of exoplanets by detecting their light curves. Light curve corresponds to the amount of reflected light the telescope receives from the planet as a function of time. One of the main characteristics of a light curve is the secondary eclipse. Secondary eclipse corresponds to the portion of the light curve when the exoplanet goes behind its star, resulting in no detectable light. Secondary eclipse is crucial in understanding the atmospheric composition of a planet. This is because when a planet enters (ingress) or exits (egress) its secondary eclipse phase, the light detected by the telescope can be used to decipher the planet’s temperature in the atmosphere.
Obtaining temperature maps from light curves
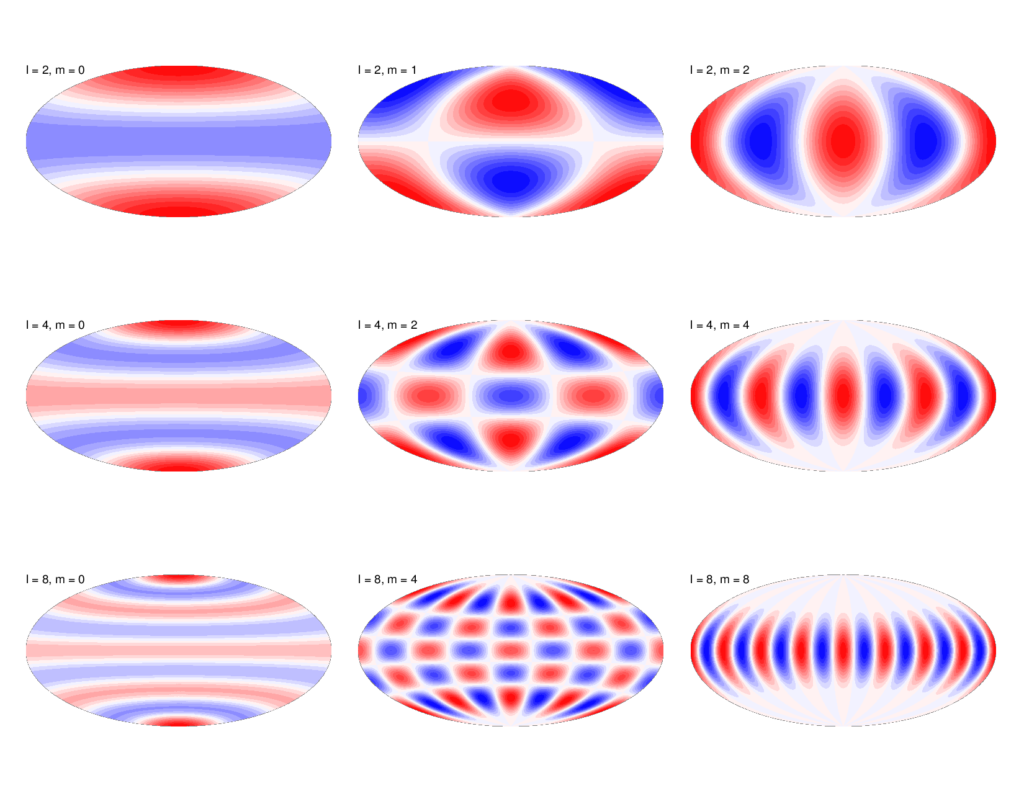
According to Rauscher et al., the first step after obtaining the light curve is to represent it as a mathematical model. The paper extensively goes over how a linear combination of spherical harmonics can be used to model the light curve. In particular, the model consists of a linear combination of the product of unknown coefficients and harmonic curves. The goal, therefore, is to solve for the unknown coefficients by fitting the model to the light curve. After modeling the light curve to spherical harmonics, it becomes relatively easy to construct a thermal map of the planet. This is because the coefficients directly correspond to the coefficients that go in front of spherical harmonic maps. Hence, taking the linear combination of the product of the coefficients and harmonic maps helps researchers construct a thermal flux map of the planet.

An example of spherical harmonic maps. Due to their spherical geometry, taking a linear combination of them becomes ideal in constructing temperature maps of exoplanets.
One drawback of using spherical harmonics to model light curves is that depending on system geometry, there may be significant degeneracies among harmonic light curves. In other words, different spherical harmonic combinations may produce identical light curves. Therefore, in order to deal with the problem of degeneracy, Principal Component Analysis (PCA) is used to construct a set of orthonormal light curves. Once the problem of degeneracy is resolved, constructing a thermal flux map from harmonic curves becomes relatively straightforward.
The thermal flux map of an exoplanet tells us the relative flux throughout the planet at a given pressure level. Areas of high pressure levels correspond to the deep parts of the planet’s atmosphere, and vice versa. Researchers expect a high overall thermal flux at higher pressure levels because of the greenhouse effect caused by the thick atmosphere. Next, Planck’s law can be used to convert an exoplanet’s thermal flux map to its temperature map.
Application: Exoplanet HD189733b
In addition to describing the techniques that go in eclipse mapping, the paper also performs the analysis on the light curve of an actual exoplanet: HD189733b. HD189733b is an exoplanet that is located approximately 63 light-years away from Earth. Due to its relative close distance, a powerful, JWST caliber, telescope is not needed to obtain its light curve. By using the light curve obtained from Spitzer, Rauscher et. al. performed the eclipse mapping analysis to construct the planet’s temperature map at a very high pressure level. According to the analysis, the median temperature at this given pressure level is 1300 K (1573 C). Just to give a context of how hot this atmosphere is, the melting point of glass is 1500 C! Anyway, the analysis proves that obtaining a temperature map of an exoplanet, given its light curve, is possible.
Cost
One may wonder how much would it cost to propose a JWST observation to detect light curves of exoplanets and whether there might be ways to cut down the costs. Rauscher et. al points out that observing only the secondary eclipse of exoplanets is much less costly, in contrast to observing the full light curve. In order to prove this claim, the paper shows and compares two temperature maps of an exoplanet. The two maps were produced by performing the analysis on the secondary eclipse and the entire light curve respectively. According to the paper, the quality of map produced by analyzing only the secondary eclipse is very similar to the map produced from the full light curve.
Further research
The main idea behind Rauscher’s work is to show that it is very possible to obtain a temperature map of an exoplanet at a specified pressure level, given its light curve. The next step is to construct a three dimensional temperature map at all pressure levels. It is theorized that scientists would be able to obtain a much higher resolution exoplanet light curve from JWST. This will enable them to use analysis similar to Rauscher’s to construct a temperature map at all pressure levels.
References
- Rauscher, E., Suri, V., Cowan, N.B., A More Informative Map: Inverting Thermal Orbital Phase and Eclipse Lightcurves of Exoplanets, http://adsabs.harvard.edu/abs/2018arXiv180605700R, 2018.
