Introduction to Ligand-Binding Affinity
Ligand-bound complexes are the basis of many reactions in biochemistry and pharmacology. Millions of these biochemical reactions take place in a human body every day. Ligands may bind to proteins, receptors, or other biologically significant molecules in circulation to trigger a biological process or pathway. Antibody-antigen interactions during an immune response and the binding of a drug molecule to its target receptor are just a few of many important examples of ligand-binding. Different classes of ligands and target molecules have different affinity levels, which are measurements of the binding rate between two specific molecules. Generally, this affinity is determined with techniques that measure tagged ligands’ behavior in binding assays. This blog post aims to compare the four main methods to measure ligand-binding affinity in experimental assays.
UV Spectrophotometry
One of the most efficacious methods for measuring protein-ligand binding equilibria is ultraviolet/visible (UV/vis) light spectrophotometry. This method is especially useful for time-resolved and steady-state research studies. Researchers use time-resolved absorption spectroscopy to detect unstable but biologically important intermediate states in chemical reactions. On the other hand, researchers examine ligand-binding affinity with steady-state absorption spectroscopy where the equilibrium reaction is more stable. Under these conditions, researchers can calculate the activation energy barrier and the Gibbs free energy difference between the bound and unbound states. Using these two methods in combination, researchers can ascertain all the necessary information to write a representative equation for the nature of the equilibrium.
UV/Vis spectra are usually recorded with dispersive dual-beam spectrometers with a white light source (usually a tungsten lamp for visible wavelengths, and a hydrogen lamp for UV wavelengths) generating monochromatic beams that pass through the sample in an alternating fashion. The absorbance spectra of proteins at room temperature are typically conducted in aqueous solvent, buffered at neutral pH to simulate physiological conditions. Engineers have constructed special solvents for lab work at cryogenic temperatures, which turn into a glass-like material with the proteins embedded inside.
The prosthetic groups in proteins are highly sensitive to conformational changes the protein may undergo when binding to another molecule or receptor. As such, their absorbance bands are strongly visible when they bind with chromophore tags. Where these absorbance bands fall depends on certain properties, such as their oxidation state or the induced conformational change.

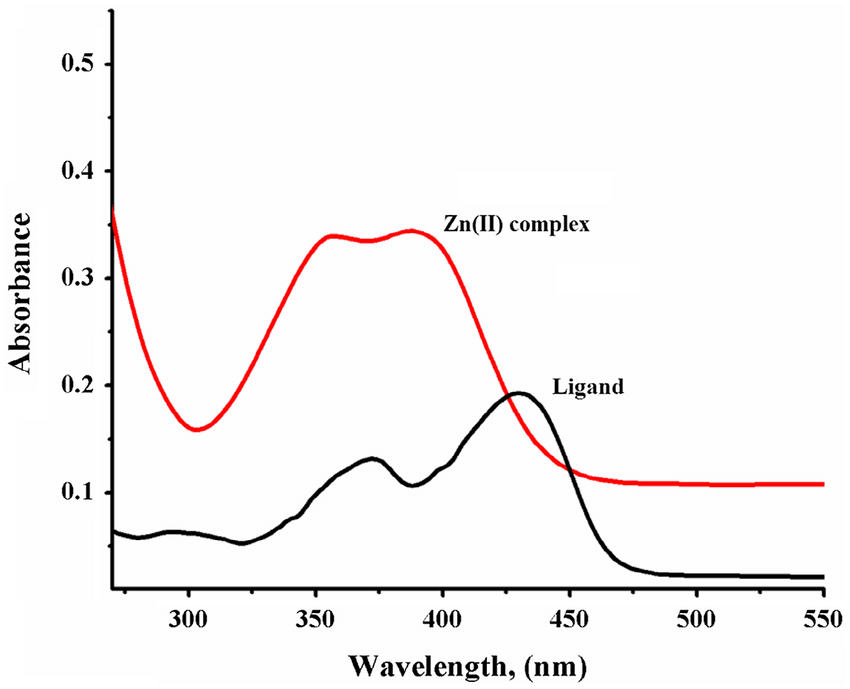
This graph shows that the absorption spectra of the ligand alone is different from its complex, with Zn2+ in this case.
Fluorescence Spectrophotometry
Fluorescence spectroscopy is one of the greatest universal tools for examining the affinity of a ligand-binding complex. This method determines affinity by observing properties like signal intensity, emission and excitation spectra, and polarization. The key benefits for fluorescently measuring steady-state binding affinity are high sensitivity, low experimental noise, and wide applications. This technique involves very little complex machinery or calculation. Yet, it is a powerful tool for determining binding constants and protein-ligand interactions. In fact, fluorescence spectroscopy provides higher sensitivity than absorption spectroscopy, and is efficacious even at very low concentrations of sample. Fluorescence typically measures signals above a low absorbance threshold, while absorption spectroscopy compares two relatively large signals.
The study of protein-ligand complexes primarily focuses on spatial information about the molecule of interest in its environment. To follow their movement in ligand-binding assays, the protein may either have its own intrinsic fluorescence, or bind to a fluorescent marker. It is possible to selectively excite and collect emission spectra for only the ligand (as long as the ligand is fluorescent), or the ligand-complex together. The emission spectra for the free ligand, the free protein, and the protein-ligand complex may result in mixed spectra that require decomposition to be scientifically useful. Different conditions call for different fluorescence protocols.

The ligand in its bound and free state will have different fluorescence spectra from each other.
NMR Spectroscopy
Nuclear magnetic resonance (NMR) spectroscopy is extremely versatile when it comes to characterizing the binding affinity of different biomolecules. NMR spectroscopy-based techniques are most useful when examining weak binding interactions. This method can rapidly screen ligand-protein binding activity down to microscopic resolution. The linewidths and chemical shifts of the NMR peaks are key data for scientists to measure their dissociation equilibrium constant. Using different active nuclei (1H or 13C) will generate different spectra, but both are equally as effective according to current literature. One-dimensional (1D) NMR spectroscopy works well for detecting the peaks of different small molecules. This method requires smaller sample amounts than other methods to produce effective and accurate readings. Ligands with extremely small dissociation constants, which represent very high binding affinity, work best for this method.
Circular Dichroism
Circular dichroism (CD) is the difference in a chiral molecule’s absorption of left-circular and right-circular polarized light. Scientists commonly use CD in situations where the secondary structure matters for protein activity. This method is specifically for chiral molecules. The generated spectra provides scientific insight into the specific bonds and structure that lend chirality to a molecule. When ligands bind to molecules, they induce a CD spectrum through structural or electronic rearrangement or perturbation, which changes the chirality of the molecule. The wavelengths of an induced spectrum depend on the ligand’s absorption spectrum. Similarly, the intensity of the induced CD spectrum is determined by the geometry and binding strength of the ligand-protein complex.
Most tetrahedral carbons of amino acid are chiral, and emit a CD signal in transitions of the neighboring amide groups and side chains. However, denatured proteins will give off very small CD signals at the most common wavelengths used with this method. When proteins are at stable conformations under physiological conditions, they are composed of well-defined units with their own chiral centers; this leads to significant CD intensities that overlap and add up to give the observed complete spectrum.
This blog post was brought to you by Zolix Instruments – a leading manufacturer of scientific instruments and analytical solutions for material science and other applications.
If you liked this article you might also enjoy our Ultimate Guide on Spectrophotometers.
