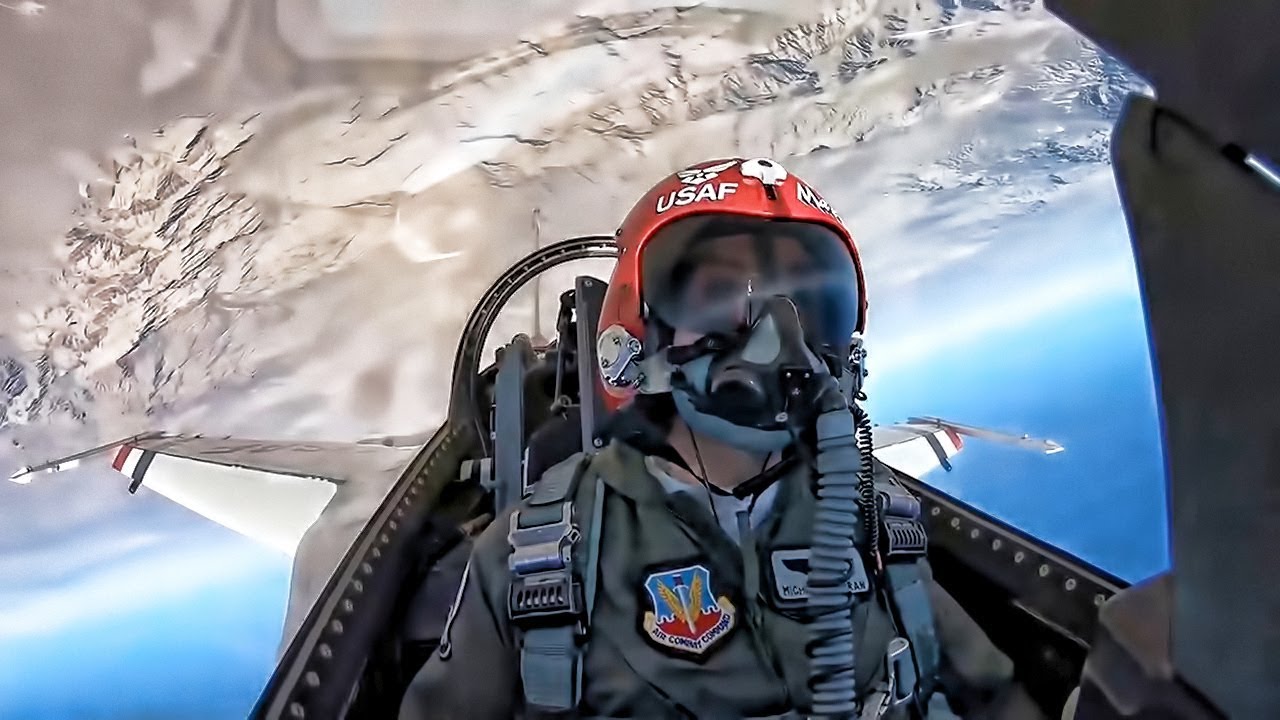
Researchers developed a safer and inexpensive method to test and train g-force tolerance. Their study analyzes hemodynamic changes in air force pilots when subject to significant orthostatic stress. Courtesy of USAF
G-Force and Training Pilots of Highly Maneuverable Aircraft
Gravitational force equivalent or g-force describes the acceleration of a body relative to the acceleration of gravity at the Earth’s surface. The magnitude of the g-force is denoted as a multiple of the force due to gravity: a body accelerating at 9.8 m/s² is accelerating at “1 G”. Increased g-force can have a dramatic effect on the human body. Roller coaster riders, for example, will experience mild symptoms of the phenomenon. Quick, dramatic changes in the track’s height create alternating feelings of weightlessness and heaviness due to negative and positive g-forces, respectively. Of course, engineers design the rides to generate a safe amount of G-force for the average person.
Fighter pilots and astronauts are regularly subject to prolonged periods of high-magnitude g-forces. In these extreme cases blood can drain from the brain at a pace that can induce vision loss or blackout. Consequently, the pilots endure extensive training to build resistance to these symptoms for the safety of the pilot and passengers on board. Trained pilots can maintain consciousness up to around 9 Gs while the average untrained person can only withstand 4 Gs. Typically, training involves simulating flight conditions with a centrifuge rotating at dizzying speed. The centrifuge is accurate and effective, but the bulky apparatus requires constant maintenance and requires considerable time to come to a stop. This poses a major safety risk to subjects who cannot tolerate the rapid acceleration.
A collaborative team from multiple institutes across Poland present their method for testing g-force tolerance in a January edition of Biomedical Optics Express. The team’s study seeks to analyze cerebral response to considerable levels of orthostatic stress. Moreover, they use their method to identify measurable parameters that can determine a pilot’s potential tolerance to the g-force he or she may experience in flight.
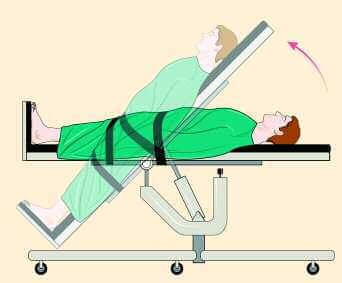
The tilt table test is used to evaluate the human body’s response to gravity. The table in this study can tilt in the negative or positive direction. Courtesy of Johns Hopkins Medicine.
Creating G-Force Effects with Tilt Tables and LBNP Chambers
In the medical field, tilt table tests quickly change the inclination of the body to evaluate the source of a patient’s unexplained fainting or rapid heartbeat. The research team capitalizes on this technology for their own study by installing a lower body negative pressure (LBNP) chamber onto the table to add physiological stress to the cardiovascular system, thereby simulating a much higher g-force . The chamber covers the participant from the feet up to a tight seal around the upper body. A pump sucks air from the chamber to create negative pressure around the legs and effectively pull blood down from the upper body. The team calls their station the ORTHO-LBNP, a system capable of inducing cerebral hypoxia with whole-body inclination.
The researchers utilize near-infrared spectroscopy to assess tolerance. Previous studies using real flight conditions show that one can monitor change in cerebral oxygenation by evaluating changes in the tissue saturation index and concentration of oxy- and deoxyhemoglobin (HbO2 and Hb) using NIRS. Near-infrared spectroscopy operates within a wavelength range that can can penetrate deep into tissue while simultaneously tracking concentration changes for HbO2 and Hb due to their unique absorption spectra. This technique is relatively inexpensive, non-invasive, and allows for real-time monitoring.
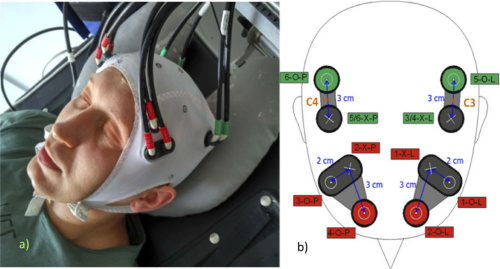
Pairs of source and detector modules transmit LED light to the head and detect diffusely scattered photons. Courtesy of OSA Publishing.
NIRS Instrumentation
The NIRS system consists of a power supply and modules for emission, detection, signal processing, and communication. The device has six LEDs that emit at 735nm and six that emit at 850 nm. A control signal codes both outputs to generate an alternating series of rectangular waves from each wavelength. Two bifurcated fiber bundles transmit that signal to two positions on the participant’s forehead; an additional four fiber bundles deliver the LED light to two positions at the motor cortex. Light at all four points penetrates into the cerebral tissue, and a detecting unit collects the diffusely reflected photons. Finally, the processing module converts the photodiode signal into digital form.
The Experiment
The participants in the study consist of a group of twelve active pilots and a group of twelve healthy volunteers. Each participant was hooked up to the NIRS system via an EEG cap. The team analyzed the changes in brain oxygenation while the body responded to the cumulative effect of the LBNP chamber and the tilting table.

A graphic of the measurement protocol at the ORTHO-LBNP station. Courtesy of OSA Publishing
Their paper describes three phases of measurement. The first phase begins at rest, rapidly tilts back to -30º, then immediately to 70º. The table stays at that position for one minute before returning to rest. The second phase utilizes the LBNP chamber to drop lower body pressure to -100mmHg for one minute while the participant is in the rest position. The third phase rapidly tilts the patient between 70º and -30º while simultaneously oscillating lower body pressure between -100mmHg and 0; the cycle repeats three times.
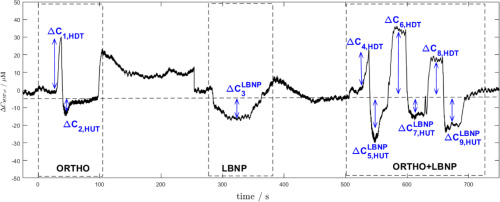
The nine parameters are denoted as change in hemoglobin concentration with a subscript for the phase. Courtesy of OSA Publishing.
Defining Parameters with Data Analysis
The team developed an algorithm that uses the intensity of reflected light from the brain tissue to calculate changes in hemoglobin concentrations. Changes in light attenuation provide information on the concentration of oxy- and deoxyhemoglobin concentration. The researchers also defined nine parameters to describe g-force tolerance based on the stimuli that produced the biggest amplitude changes in total hemoglobin concentration. The above graph shows the all nine stimuli over the three phase process. Each correlates with a significant change in cerebral hemodynamic conditions.
The Results
Phase One
Cardiovascular response during phase one shows total hemoglobin concentration increased in all subjects at the -30º . All also showed a decrease at the 70º position. Both groups, the pilots and the control, show similar patterns of change in total hemoglobin.
Phase Two
The second phase should show significant decrease in total hemoglobin concentration due to sudden decrease in circulation in the upper body. Some subjects, however, had no change in total hemoglobin or the related oxy- and deoxyhemoglobin. A few participants even saw increase in hemoglobin.
Phase Three
In phase three, all subjects show decrease in concentration of both total hemoglobin and oxyhemoglobin while deoxyhemoglobin remained roughly constant. All concentrations returned to normal after the table tilted back to -30º and the chamber pressure increased.
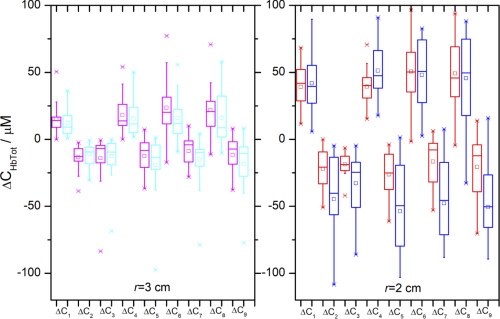
The plots presents parameters for source-detection distance 3cm and 2 cm (left to right). Pilots are in pink and red, and control group members are in cyan and blue. Courtesy of OSA Publishing.
Comparing the Control Group to the Pilots
The researchers directly compared the study and control groups for all nine calculated parameters of cerebral hemodynamic changes. Each provides presents two sets of data for source-detector distances of 2 cm and another at 3 cm. The plots portray an effect of cerebral autoregulation, a mechanism which prohibits large changes in cerebral blood flow when subject to substantial driving pressure. Accordingly, the shorter source-detector separation recorded larger hemodynamic changes.
At a 3 cm source-detector separation, parameters associated with reduced blood flow are significantly higher in the control group than the pilots. The differences between the groups is even more noticeable at the shorter source-detector separation. The pilots, therefore, showed considerably higher tolerance to the g-force simulation. In addition, all parameters associated with phase three are much larger than any parameter in phase one or two. This confirms that combining the two technologies creates more dramatic changes in cerebral blood flow.
Discussion and Conclusion
The research team discusses the results of their study in the context of previous reports. Comparatively, the researchers observed a much smaller response to the LBNP chamber. An in-vivo study on hypovolemia reported participants experienced symptoms of nausea, blurred vision, and dizziness while laying flat and the LBNP set to -50mmHg. The present study saw no such symptoms despite applying -100mmHg. This can likely be attributed to differences in seal position: sealing the chamber at the upper abdomen will displace a much larger blood volume compared to a seal at the waist.
Nonetheless, the team successfully generated significant orthostatic stress with their ORTHO-LBNP prototype. NIRS-generated charts of total hemoglobin concentration established nine parameters to determine a participant’s tolerance to immense g-force. These parameters allowed the team to directly compare the brain’s hemodynamic response in a group of pilots versus a control group. Furthermore, a follow-up orthogonal partial least squares discriminant analysis with the parameters classified participants into their groups with 100% accuracy. Looking forward, this method could provide a safer, less expensive alternative to the centrifuge to test and train G-tolerance in pilots of highly maneuverable aircraft.
For more on the ORTHO-LBNP, find the publication here.
This post is sponsored by Connet Laser - a market leader in fiber lasers and optical fiber technologies.
